Singapore Property Monthly
Your monthly briefing on the Singapore property market — HDB, private residential, landed, commercial & industrial — with the financing and macro context that moves it.
A cooling market meets a policy surprise
Singapore's property market spent Q2 settling into a lower gear — private prices rose at their slowest pace in seven quarters and HDB resale values slipped for a second straight quarter. Then, in the final week of July, the Government delivered the most significant policy move of the year: the 15-month wait-out period for private owners buying HDB resale flats was removed, effective 28 July.
- Private residential cooled but didn't crack. Prices rose 0.5% in Q2 (Q1: +0.9%). Beneath the headline, the market split: landed jumped 2.5% and the luxury core (CCR) gained 1.8%, while mass-market and city-fringe condos slipped.
- HDB resale fell 0.3% even as volume held at 6,396 flats — and million-dollar transactions hit a record 491 in a single quarter. The wait-out removal reopens the private-downgrader channel and is the key variable for Q3.
- Financing is the cheapest since 2022. 3M SORA sits near 1.12% and fixed packages start around 1.3–1.4%. But the US Fed has turned hawkish — markets now price a September hike as more likely than not — so this window may narrow.
- Commercial stayed resilient. Grade A CBD office rents rose a sixth consecutive quarter; industrial rents extended a 23-quarter run. Institutional capital was active: S$15+ billion of Q2 investment sales.
- Geopolitics cut both ways. The Middle East conflict lifted oil past US$100 and pushed MAS to tighten twice — yet the same instability is driving safe-haven wealth toward Singapore: ultra-luxury deals hit a 15-quarter high.
View data as table
| Quarter | URA private | HDB resale |
|---|---|---|
| Q3 2024 | 204.7 | 192.9 |
| Q4 2024 | 209.4 | 197.9 |
| Q1 2025 | 211.1 | 201.0 |
| Q2 2025 | 213.2 | 202.9 |
| Q3 2025 | 215.1 | 203.7 |
| Q4 2025 | 216.4 | 203.6 |
| Q1 2026 | 218.3 | 203.4 |
| Q2 2026 | 219.4 | 202.8 |
The 15-month wait-out is gone
Announced 27 July and effective 28 July 2026, private property owners and ex-owners can once again buy non-subsidised HDB resale flats without waiting 15 months after selling. The rule, imposed in September 2022 to cool resale prices, was retired after two consecutive quarters of HDB price declines.
The purchase must be financed with cash or a bank loan (no HDB loan); all private property — local and overseas — must be disposed of within six months of completion. The 30-month wait-out remains for subsidised flats, CPF housing grants, new ECs and HDB loans.
Why it matters for you: private owners' share of million-dollar flat purchases had fallen from roughly a third (2022) to ~12% (late 2024) under the rule. Reopening this channel puts a floor under the resale market — particularly larger, central flats — just as it was softening. Watch the September data for the first clean read.
Elsewhere the regime is unchanged: ABSD stays at 60% for foreigners, TDSR 55%, LTV 75%. The most recent cooling measure remains July 2025's extension of the Seller's Stamp Duty to a four-year holding period.
Prices drift, records fall anyway
The resale index eased 0.3% in Q2 — a second straight dip, leaving prices flat year-on-year. Volume told a different story: 6,396 flats changed hands (+1.8% QoQ), and 491 crossed the million-dollar mark — a record quarter, at 7.9% of all transactions. Toa Payoh, Queenstown and Bukit Merah led the 1H tally of 902 such deals.
Supply ahead: June's BTO exercise offered 6,952 flats across Ang Mo Kio, Bishan, Bukit Merah, Sembawang and Woodlands; October brings the year's largest launch — roughly 7,960 flats across Bedok, Geylang, Sembawang, Tengah, Toa Payoh and Yishun. With ~19,600 BTO flats for the full year and a doubling of MOP supply, the medium-term pressure on resale prices is real — one reason the wait-out removal landed when it did.
| Pipeline | Flats | Detail |
|---|---|---|
| June 2026 BTO exercise | 6,952 | Ang Mo Kio, Bishan, Bukit Merah, Sembawang, Woodlands |
| October 2026 BTO exercise | ~7,960 | Largest launch of the year — Bedok, Geylang, Sembawang, Tengah, Toa Payoh, Yishun |
| Full-year 2026 BTO programme | ~19,600 | Announced supply target for the year |
| Flats reaching MOP in 2026 | 13,480 | Nearly double 2025 — tomorrow’s resale supply |
The market splits three ways
Non-landed prices overall slipped 0.1% in Q2, but the average hides a sharp regional divergence: the Core Central Region gained 1.8% on luxury demand while the Rest of Central Region fell 1.2% and the suburbs were flat. Developers sold 2,141 new units; the resale market did the heavier lifting at 3,813 units — 62% of all transactions.
View data as table
| Segment | QoQ change |
|---|---|
| Landed | +2.5% |
| Non-landed — CCR | +1.8% |
| All private residential | +0.5% |
| Non-landed — OCR | −0.1% |
| Non-landed overall | −0.1% |
| HDB resale | −0.3% |
| Non-landed — RCR | −1.2% |
Launches still clear at the right price. Lentor Gardens Residences moved 54% of its 499 units on launch day at an average of S$2,350 psf; a week later Dunearn House sold 56% of 380 units at S$3,140 psf, with every standard three-bedder gone. Buyers are selective, not absent.
Rentals firmed — the rental index rose 0.7% (Q1: +0.3%), with 22,290 leases signed. Vacancy ticked up to 6.4% as new completions landed. The unsold pipeline shrank 7% to under 15,000 units, but note the supply overhang building further out: the 2026 Confirmed List is the largest in over a decade.
The quarter's quiet outperformer
Landed prices surged 2.5% in Q2, reversing Q1's 0.4% dip — the strongest segment in the market. Landed rentals rose 2.7%, against 0.4% for condos. Scarcity is doing the work: with no meaningful new landed supply and safe-haven wealth consolidating in Singapore, good freehold stock commands a premium. For owners, this is a strong holding position; for buyers, entry timing matters more than ever.
Institutional money votes with its feet
| Segment | Rents QoQ | Prices QoQ | Vacancy / occupancy | Signal deal |
|---|---|---|---|---|
| Office | +0.8% | +0.4% | 11.0% vacancy island-wide; core Grade A just 3.3% | Asia Square Tower 2 — S$2.48b (S$3,180 psf) |
| Retail | +0.6% | +0.8% | 6.5% vacancy | White Sands — S$467m, 8.4% above valuation |
| Industrial | +0.5% | +0.6% | 89.1% occupancy (business parks 77.9%) | Kim Chuan data-centre complex — 32% premium |
| Shophouses | — | — | Volume near a 30-year low (~S$88m in Q1) | No revival visible in Q2 reporting |
Office
URA's office rental index rose 0.8% (reversing Q1's dip) and prices edged up 0.4%. The top of the market is tight: CBRE puts Core CBD Grade A rents at S$12.50 psf/month — a sixth straight quarterly rise — with core vacancy at just 3.3%, even as island-wide vacancy (all grades) sits at 11.0%. Shaw Tower's completion marks the last major office delivery of 2026; consultants see 4–5% Grade A rent growth this year. The signal deal: CICT's S$2.48 billion sale of Asia Square Tower 2 to IOI Properties at S$3,180 psf.
Retail
Retail rents recovered 0.6% after a soft Q1; prices rose 0.8%; vacancy inched up to 6.5%. Prime rents are grinding higher (~S$29 psf/month island-wide, Knight Frank) with suburban malls outpacing Orchard. F&B churn continues beneath the surface. Frasers Centrepoint Trust's S$467 million sale of White Sands — 8.4% above valuation — shows suburban retail assets remain in demand.
Industrial
JTC's all-industrial rental index rose 0.5% — a 23rd consecutive quarter of growth — with prices up 0.6% and occupancy at 89.1%. Business parks remain the exception (rents −0.1%, occupancy 77.9%). AI-driven electronics demand is the engine; ~4.4 million sq ft of new space lands in 2H2026. CapitaLand Ascendas REIT's divestment of the Kim Chuan data-centre complex at a 32% premium underlines where the heat is.
Shophouses
Still the market's cold corner: Q1 volume (~S$88m, 13 caveats) was near a three-decade low, and no revival was visible in Q2 reporting. A buyer's patience market.
Cheap money — with a hawkish asterisk
Mortgage pricing is the friendliest since 2022: SORA has collapsed from ~3% in early 2025 to about 1.1%, and banks are quoting fixed packages from the low-1.3s. This is quietly underwriting demand across every segment above.
| Rate | S$500k loan | S$750k | S$1.0m | S$1.5m |
|---|---|---|---|---|
| 1.40% — today’s low fixed | S$1,976 | S$2,964 | S$3,953 | S$5,929 |
| 2.00% | S$2,119 | S$3,179 | S$4,239 | S$6,358 |
| 2.60% | S$2,268 | S$3,403 | S$4,537 | S$6,805 |
| 3.20% — early-2025 territory | S$2,423 | S$3,635 | S$4,847 | S$7,270 |
The asterisk is direction. The July FOMC held rates but drew three dissents — for a hike — and futures now price a September increase as more likely than not, on energy-driven inflation from the Middle East conflict. MAS has already tightened twice this year (April, and again on 27 July), citing the same pressures; core inflation is forecast at 1.5–2.5% for 2026. Singapore's Q2 GDP grew a robust 5.7%, so policy has room to lean against inflation.
Practical read: clients weighing fixed vs floating should note the risk is now asymmetric — floating rates have little room to fall further, and the global direction of travel has flipped. Locking multi-year fixed money near 1.4% may look very good in hindsight.
Instability abroad, a bid for Singapore
- Middle East conflict. June's escalation between Israel, Iran and the US pushed Brent past US$100. Singapore imports over half its crude from the region; the pass-through to inflation is why MAS tightened. Prolonged conflict = higher-for-longer rates.
- The safe-haven bid is real and measurable. Ultra-luxury transactions (non-landed ≥S$10m) hit a 15-quarter high of 23 deals in Q2; CCR homes above S$5m posted their strongest first half in four years (+24.7% YoY). Consultants report relocation enquiries rising as Gulf instability dims competing hubs. Family-office formation continues to compound.
- US tariffs. February's global tariff (10%, announced rising to 15%) has had limited direct effect on Singapore so far, per MTI — but watch the export-dependent industrial and office demand channels if trade friction escalates through 2H.
- Johor–Singapore integration. The RTS Link is ~90% complete and on schedule for 1 January 2027 passenger service, with the JS-SEZ master plan near finalisation. Expect this to feature heavily in 2027 outlooks for both rental demand and cross-border investment.
What we're tracking next
- First post-wait-out-removal resale data — does the private-downgrader channel lift million-dollar flat volumes further?
- The Fed's September meeting: a hike would mark the global turn and eventually feed into SORA.
- October BTO exercise (~7,960 flats) — the year's largest, and its pull on resale demand.
- Amberwood at Holland launch results as a read on prime District 10 appetite.
- Q3 flash estimates from URA and HDB (due 1 October).
Go deeper than the monthly headlines
This briefing tells you what moved this month. The books explain the machinery underneath — policy architecture, market structure, and the decisions in front of you. And for the lighter side of property fever, there's Mr Mai.
 Premium research · S$5
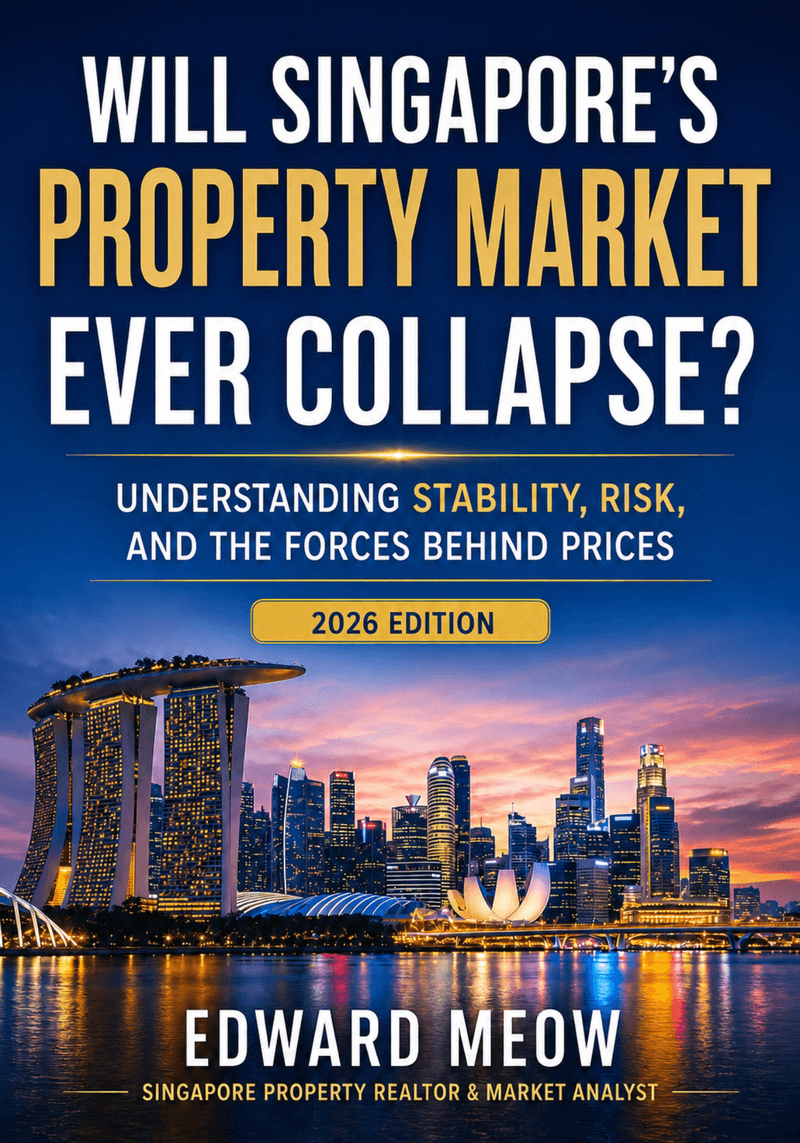
Will Singapore's Property Market Ever Collapse?
123 pages on stability, risk, policy and the forces behind prices — with scenario modelling through 2036.
View the report →
Premium research · S$5
Will Singapore's Property Market Ever Collapse?
123 pages on stability, risk, policy and the forces behind prices — with scenario modelling through 2036.
View the report →
 Free guide
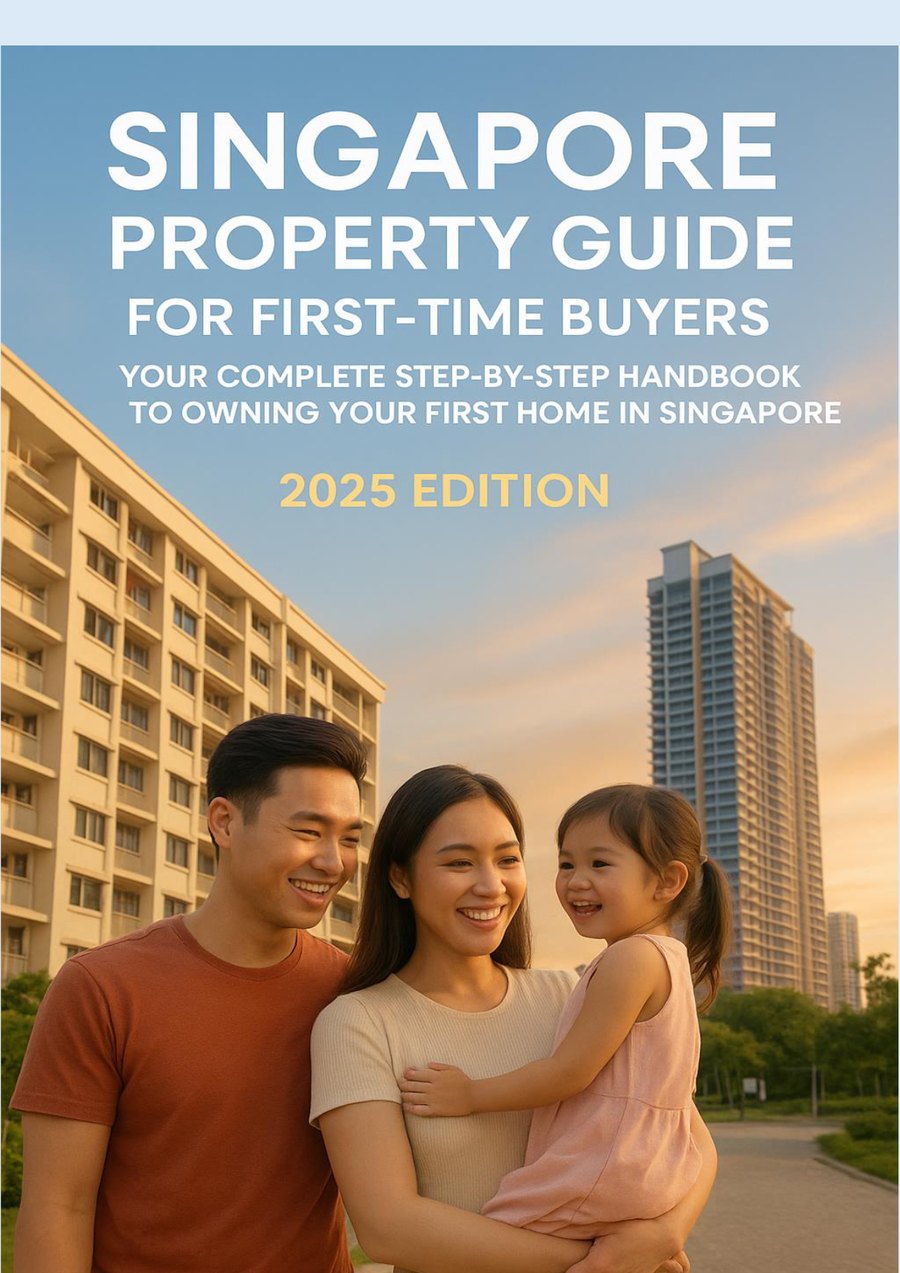
Singapore Property Guide for First-Time Buyers
A 63-page step-by-step handbook: budget, financing, grants, property types and the buying process.
Read it free →
Free guide
Singapore Property Guide for First-Time Buyers
A 63-page step-by-step handbook: budget, financing, grants, property types and the buying process.
Read it free →
 Animated comic · Book 1 free
Mr FOMO Mai — Lift B, Unit 12B & Other Confirmed Things
Eight animated episodes of property-fever satire from a Singapore condo lift lobby — for everyone who has ever refreshed a price chart at 2am.
Watch Book 1 free →
Animated comic · Book 1 free
Mr FOMO Mai — Lift B, Unit 12B & Other Confirmed Things
Eight animated episodes of property-fever satire from a Singapore condo lift lobby — for everyone who has ever refreshed a price chart at 2am.
Watch Book 1 free →
This issue draws on
- Official statistics: URA Q2 2026 real estate statistics, final release 24 Jul 2026 (pr26-57); HDB Q2 2026 resale statistics & wait-out announcement, 27 Jul 2026 (hdb.gov.sg); JTC Quarterly Market Report Q2 2026, 23 Jul 2026; SingStat table M212261 & data.gov.sg HDB resale price index; MTI Q2 2026 GDP advance estimate, 14 Jul 2026; MAS Monetary Policy Statement, 27 Jul 2026; June 2026 Consumer Price Developments (MAS/MTI).
- Industry research & press: CBRE, Cushman & Wakefield, JLL, Knight Frank and Colliers Q2 2026 market reports; PropNex and ERA analyses of official Q2 data; EdgeProp, The Business Times, Stacked Homes, 99.co and Reuters/CNA reporting, Jun–Jul 2026.
- Rates: 3M compounded SORA and mortgage package rates via industry rate trackers, 23 Jul 2026; US FOMC statement and market pricing, 29 Jul 2026.
Where flash estimates and final releases differed, final figures are used. Analyst forecasts are attributed and are opinions, not facts.