Singapore Property Monthly
Your monthly briefing on the Singapore property market — HDB, private residential, landed, commercial & industrial — with the financing and macro context that moves it.
The rally nobody traded
The third quarter described a market that grew more expensive while it very nearly stopped transacting. URA's flash estimate has private home prices up 1.4% — the fastest quarterly rise since the end of 2024 — on new-home sales that fell by half to their weakest third quarter since 1998. The suburbs led and the core slipped, inverting the second quarter exactly. Meanwhile the Fed delivered the hike we flagged last month, MAS confounded every forecaster by sitting still, and HDB told the market plainly that scrapping the 15-month wait-out has not moved resale prices.
- Prices up, volume gone. The private index rose 1.4% in the Q3 flash against +0.5% in Q2 — landed +2.8%, OCR +2.2%, CCR −0.1% — while sale transactions to mid-September came in at 4,296 against 6,148 the quarter before. Realion reads the jump mainly as mix: 71.7% of new sales were priced at S$2 million or above, up from 52.3% in Q2.
- The HDB index fell again — and set a record inside the same quarter. The resale index slipped 0.2% to 202.4, a third straight decline, yet 7,528 flats changed hands (+17.7% QoQ) and September logged a record 209 million-dollar resales.
- HDB's own verdict on a year of loosening: nothing measurable. The board said it has not seen a significant increase in prices, or in purchases by private and ex-private property owners, since the wait-out was removed on 28 July — even as agents report livelier enquiries.
- The Fed moved; MAS did not. A 25bp hike on 16 September took the target range to 3.75–4.00%, on a 12–0 vote and the first increase since 2023; the minutes show most officials expect another by year-end. Then on 14 October MAS held its policy band unchanged, against a Reuters poll in which all ten analysts expected tightening.
- Land bids kept setting records while buyers hesitated. A UOL-led consortium paid a record OCR rate of S$1,537 psf ppr at New Upper Changi Road, Eco World took a Sin Ming site at S$1,612 psf ppr, and a Canberra Drive EC plot drew 13 bids — the most in eight years — at a record S$825 psf ppr.
View data as table
| Quarter | URA private | HDB resale |
|---|---|---|
| Q4 2024 | +2.3% | +2.6% |
| Q1 2025 | +0.8% | +1.6% |
| Q2 2025 | +1.0% | +0.9% |
| Q3 2025 | +0.9% | +0.4% |
| Q4 2025 | +0.6% | −0.1% |
| Q1 2026 | +0.9% | −0.1% |
| Q2 2026 | +0.5% | −0.3% |
| Q3 2026 (flash) | +1.4% | −0.2% |
The first official verdict on a year of loosening
No new housing measure was announced between 1 September and mid-October — and that absence is the point. 2026 has already delivered two significant loosenings, and the Q3 flash estimates released on 1 October are the first official measurement of either. The early read is anticlimactic, which in housing policy is usually the intended outcome.
| Date | Measure | First official read |
|---|---|---|
| 28 Jul 2026 | 15-month wait-out removed for private and ex-private owners buying non-subsidised resale flats | Q3 flash, 1 Oct — HDB reports no significant price or volume effect |
| 24 Aug 2026 | BTO income ceiling to S$16,000, EC to S$18,000, singles to S$8,000 | Not yet measurable; first test is the November BTO exercise |
| 1 Oct 2026 | URA and HDB Q3 flash estimates | Private +1.4% QoQ; HDB −0.2% QoQ |
| 23 Oct 2026 | Full Q3 statistics from URA and HDB | Pending — URA cautions that flash estimates have differed from final figures |
| Nov 2026 | Year's final BTO exercise, ~7,960 flats | Exact launch date not yet announced |
Alongside the flash estimate, HDB said it has not observed a significant increase in resale prices, or in purchases by private property owners and ex-private property owners, since the wait-out period was removed on 28 July. That is a direct rebuttal of the downgrader-flood thesis — including the version we set out in last month's issue. Analysts are not uniformly convinced: Realion's Christine Sun reports "a noticeable increase in buying interest and sales enquiries from private homeowners", while Huttons' Lee Sze Teck agrees the price effect was "relatively muted" in Q3 and expects the resale market to bottom in the fourth quarter.
The November BTO exercise is the next real policy event. Roughly 7,960 flats across six towns will be offered — the launch was pushed from October to November precisely so households could requalify under the higher income ceilings, with HDB asking for supporting documents by 25 September to ballot in November. HDB has not yet published the launch date, the project names or the Standard/Plus/Prime classifications, and no figures on post-deadline application volumes have been released, so the ceiling rise remains unmeasured for now.
On the monetary side, policy also stood still — see §06. MAS left the S$NEER band untouched on 14 October and said nothing about the property market, while keeping the TDSR interest-rate floor at 4%.
A third quarter down, a record month inside it
The resale price index fell 0.2% in the Q3 flash to 202.4, from 202.8 — a third consecutive quarterly decline, and a marginally shallower one than Q2's 0.3%. What makes the quarter unusual is that the softening came with a surge in activity rather than a drought: 7,528 flats were transacted, up 17.7% on the quarter, with larger flats leading — five-room resales rose 23.7% and executive flats 39%. HDB's own framing was that volume "has remained broadly stable even as prices eased".
The top of the market set records while the index fell. Q3 produced 597 resales at or above S$1 million — 8.5% of all transactions — at an average of about S$1.16 million, up 1.1% on the quarter. September alone accounted for a record 209 of them, ahead of August's 201. The segment also broadened: Huttons counts 11.4% of million-dollar deals in non-mature estates, the highest share recorded. And the national ceiling moved twice within about a week in September, settling at S$1.72 million for a five-room flat at Pinnacle@Duxton. With 2025's full-year record of 1,594 million-dollar resales in view and a quarter still to run, the annual record is the number to watch in the November issue — we are not calling it before the monthly counts are confirmed.
| Town / site | Approx. flats | Note |
|---|---|---|
| Bedok — Bayshore | ~2,500 | Two projects; the exercise's largest offering |
| Yishun — Chencharu | ~1,580 | |
| Toa Payoh — Caldecott | ~1,430 | Includes Community Care Apartments |
| Sembawang North | ~1,310 | |
| Tengah — Garden Avenue | ~710 | First Tengah launch in three years |
| Geylang — Mattar | ~440 |
Forecasters are clustered but not agreed on where the year ends. Huttons expects 22,000–26,000 resale transactions in 2026 with prices between −1% and +1%; ERA's Eugene Lim looks for about 26,000 transactions and growth of 2–5%. The gap between those two price calls is the gap between a market that has bottomed and one that has not.
The suburbs lead, the core stalls
The non-landed index rose 0.9% in the Q3 flash after a 0.1% dip in Q2 — but the regional composition reversed almost perfectly. The Outside Central Region, which fell 0.1% in Q2, rose 2.2%. The Core Central Region, which rose 1.8% in Q2, slipped 0.1%. The city fringe barely moved, up 0.2% after a 1.2% fall. Where last quarter the story was a firm core and a soft suburb, this quarter it is the exact opposite.
View data as table
| Segment | QoQ change |
|---|---|
| Landed | +2.8% |
| Non-landed — OCR | +2.2% |
| All private residential | +1.4% |
| Non-landed overall | +0.9% |
| Non-landed — RCR | +0.2% |
| Non-landed — CCR | −0.1% |
| HDB resale | −0.2% |
A rising index on collapsing volume needs explaining, and the explanation is mix. New private home sales excluding ECs fell 49.5% on the quarter to roughly 1,100 units — the weakest third quarter since 1998 — and total sale transactions to mid-September were down about 30%. Realion's reading is that the index moved because of what sold, not because sellers won more: the share of new-sale transactions priced at S$2 million or above jumped from 52.3% in Q2 to 71.7% in Q3. When the cheap end of the market stops transacting, an average price can rise without a single buyer paying more than they would have in June.
September itself was a recovery from a near-dead August. Developers moved 296 units, up 93.5% on the month and 16.1% on the year, having sold just 153 in August — the lowest monthly total since February 2024. Year to date, 5,334 units have sold against 7,875 in the same period of 2025.
| Project | Units sold | Median S$psf |
|---|---|---|
| Terra Hill | 32 | 2,209 |
| The Sen | 25 | 2,386 |
| Amberwood at Holland | 24 | 3,021 |
| Lentor Gardens Residences | 22 | 2,348 |
| Union Square Residences | 21 | 2,813 |
| Luxus Hills | 18 | 3,455 |
Two launches, two verdicts — and they map onto the regional split. Amberwood at Holland, the District 10 project we flagged two issues ago, opened on 25–26 September with 70 of its 212 units released. EdgeProp counted 23 sold over the weekend, about a third of what was released and 11% of the project, at an average near S$3,019 psf; URA's September tally for the project is 24 units. EdgeProp rates it the weakest launch-weekend take-up of any Core Central launch in twelve months — against Skye at Holland's 99% and River Modern's 90%. The project has no one- or two-bedroom units, which narrows its buyer pool considerably; over 60% of what sold was four- or five-bedroom.
A week later, CDL's Lucerne Grand at Lakeside Drive sold 350 of 570 units — 61.4% — over the 3–4 October weekend at an average of about S$2,480 psf, with two-bedders from S$1.498 million. One launch asked buyers for S$3 million in the core and found a thin market; the other asked S$1.5 million in the suburbs and cleared six units in ten. That is the OCR's +2.2% and the CCR's −0.1%, told as two weekends.
Developers are still paying up for land. Three Q3 tenders set records. A UOL–CapitaLand Development–Singapore Land joint venture topped four bids at New Upper Changi Road in Bedok with about S$1.425 billion, or S$1,537 psf ppr — a record for an OCR site, awarded in early September. At Lorong Puntong off Sin Ming Avenue, Eco World beat six rivals at S$208.1 million, or S$1,612 psf ppr, above the S$1,350–1,500 analysts expected; CIMB Research reckons it needs launch pricing above S$3,000 psf to work. And on 1 October a Canberra Drive EC site drew 13 bids — the most for any site in eight years — with a top bid of S$163.9 million, or a record S$825 psf ppr for EC land. Whatever developers think of this quarter's sales volume, they are bidding for 2028.
The strongest segment, again
Landed homes rose 2.8% in the Q3 flash, after 2.5% in Q2 — once again the best-performing segment in the market, and the only one growing at a pace that would read as a boom in isolation. For once the volume data points the same way: 19 new landed homes were sold in September, the highest monthly figure since April 2018, led by 18 terraces at Luxus Hills and nine semi-detached strata units at Belgravia Ace.
At the very top, the quarter was quiet in public: no Good Class Bungalow transaction was confirmed in September or the first half of October. The most recent official read remains Q2's seven caveated GCB deals at an average land rate of S$2,341 psf, up from S$1,803 psf in Q1. The structural case we have made in both previous issues is intact — scarce stock, safe-haven demand, no new supply — and landed is now the segment where it shows most clearly in the index.
Offices tighten while capital keeps arriving
If the residential market spent Q3 hesitating, the commercial market spent it accelerating. Every consultancy that has reported Q3 office figures has rents rising and vacancy falling; they disagree substantially on magnitude, because each measures a different basket.
| Firm · basket | Rent (S$ psf/mo) | QoQ | Vacancy / occupancy |
|---|---|---|---|
| CBRE · Core CBD Grade A | 12.75 | +2.0% | 2.6% vacancy (from 3.3%) |
| JLL · CBD Grade A, gross effective | 12.32 | +1.0% | 5.9% CBD vacancy — a 10-quarter low |
| Knight Frank · Raffles Place / Marina Bay prime | 11.87 | +1.5% | 97.4% occupancy (+0.7 ppt) |
| Cushman & Wakefield · CBD Grade A | — | +1.0% | 3.9% vacancy |
The supply picture explains the squeeze: Newport Tower is the only significant non-strata completion due in 2027, with the next real wave — The Skywaters, The Clifford, One Comcentre, Union Square Central — arriving in 2028. Landlords have roughly two years of scarcity to price into renewals.
Investment sales
Three firms, three numbers, one direction. Knight Frank puts Q3 investment sales at S$10.7 billion, CBRE at a preliminary S$12.6 billion, and Cushman & Wakefield at S$9.1 billion — definitions differ, so take each only against its own history. All three agree the first nine months have already exceeded the whole of 2025, and Knight Frank expects a record year of roughly S$50 billion. Knight Frank's Q3 split puts about S$4.3 billion in residential (mostly government land sales plus a roughly S$1 billion deal at 8 Thomson Lane), S$2 billion in commercial and S$2 billion in industrial.
The clearest trend is foreign capital concentrating in CBD offices. IOI Properties has exercised its option on Asia Square Tower 2 at an indicative S$2.474 billion from CapitaLand Integrated Commercial Trust, with completion expected in the second half of this year, and has submitted a joint expression of interest with a CapitaLand Investment-managed entity for One Raffles Place, reportedly valued near S$2.4 billion — no definitive agreement has been signed. Earlier in the year Hongkong Land bought Wheelock Place for S$1.1 billion; in Q3, Scotts Square mall changed hands for S$310 million.
Industrial
JTC's Q3 statistics are not out — on the pattern of recent quarters they are due around 23 October, and we will carry them next month. The consultancy readings are mild: CBRE has prime logistics rents up 0.5% on the quarter after a flat first half, conventional factory rents up 0.6% and warehouse rents unchanged, with islandwide business-park vacancy still high at 21.9%. Cushman & Wakefield also has factory rents up 0.6%, and high-tech up 0.3%. The money, though, was dramatic: Knight Frank counts roughly S$2 billion of industrial investment in Q3, more than double Q2, anchored by JTC and worker-dormitory land sales.
Retail and shophouses
Retail rents rose modestly across the board — Cushman & Wakefield has Orchard and suburban prime rents both up 0.3% on the quarter and other city areas up 0.7%, while CBRE reports gains in every submarket including City Hall/Marina Centre at +0.5%. In shophouses the drought persists: Huttons counts 21 caveats worth S$157.7 million in Q3, down 18.6% by value, and 51 deals worth S$441.3 million over nine months against 68 deals worth S$644.5 million a year earlier. More than 70% sold above S$5 million.
We flagged the People's Park Centre collective sale — a third attempt at a S$1.48 billion guide price, implying roughly S$2,455 psf ppr — with its tender closing 16 September. As of publication we have found no credible report of the outcome: no winning bid, no named bidder, no declared no-sale. Rather than infer one, we are leaving it open and will report it when it is confirmed. Elsewhere, Beauty World Plaza is reported to be trying again at S$165 million, with a tender closing 19 November.
The hike arrived. The window closed.
Last month we wrote that clients on floating packages or facing a reprice "should price the fixed-versus-floating decision before 17 September rather than after it." That advice can now be marked. On 16 September the Federal Reserve raised its target range by 25 basis points to 3.75–4.00% — a unanimous 12–0 vote, and the first increase since 2023 — saying the move supported a "timelier return" to its 2% goal. Chair Kevin Warsh told the press conference he needed to see underlying inflation moving to target "clearly and at sufficient speed", and judged that it had not. The minutes released on 7 October show most officials expect another increase before year-end, with the next meeting at the end of October.
Transmission to Singapore borrowers has been real but gentle. Three-month compounded SORA was about 1.24% on 14 October, against the 1.12% we reported in August — roughly 12 basis points of drift, not a repricing shock. The visible change is at the bank counter: the cheapest two-year fixed package for private property is now around 1.70% (Standard Chartered), with 1.65% available for HDB flats (Hong Leong), where a month ago the best fixed money started near 1.40%. The lowest floating spreads sit at three-month SORA plus 0.20% from HSBC and Maybank, about 1.43% all-in. HDB's concessionary rate is unchanged at 2.60%, which continues to make a bank loan the cheaper option for most eligible buyers — subject to the 30% mortgage servicing ratio.
Then MAS did nothing, and that was the surprise. At its 14 October policy statement MAS left the slope, width and centre of the S$NEER band unchanged, after a "slight" steepening in April and a "very slight" one in July. All ten analysts in a Reuters poll had expected tightening; DBS attributed the pause to softer-than-expected inflation. MAS now forecasts core inflation averaging 1.5–2.0% for 2026 and headline around 2%, while warning that "risks to inflation remain tilted to the upside". The statement made no reference to the property market.
| Rate | S$500k loan | S$750k | S$1.0m | S$1.5m |
|---|---|---|---|---|
| 1.70% — today’s lowest fixed | S$2,047 | S$3,071 | S$4,094 | S$6,141 |
| 2.00% | S$2,119 | S$3,179 | S$4,239 | S$6,358 |
| 2.60% — HDB concessionary | S$2,268 | S$3,403 | S$4,537 | S$6,805 |
| 3.20% — early-2025 territory | S$2,423 | S$3,635 | S$4,847 | S$7,270 |
How much stress is in the system? MAS's September Financial Stability Review, with data to Q2, is reassuring on the aggregate: the housing non-performing loan ratio is 0.2%, household financial assets grew 9.5% year-on-year against 8.3% for liabilities, and the debt-to-disposable-income ratio of 1.08x sits below its ten-year average. MAS stress-tested a 200 basis point mortgage-rate rise alongside a 10% income fall and found about 1% of borrowers would face negative cash flow with buffers under six months — concentrated among middle-aged, lower-income HDB households. Its own advice is that households "remain cautious in taking on additional leverage" if global rates rise further.
Practical read: the cheapest fixed money of this cycle is behind us, but the move is 30 basis points, not 300. For anyone repricing now the question has shifted from "lock the floor" to "lock before the next one" — the Fed's own minutes point to another hike this year, and UOB's published forecast has three-month SORA near 1.40% by December. For buyers, the arithmetic above matters more than the headline: 30bp is about S$141 a month on a million-dollar loan, which changes a budget at the margin, not a decision.
Strong growth, firmer inflation, dearer money
- The economy kept beating expectations. Q3 GDP grew 5.4% year-on-year on MTI's advance estimate released 14 October, and 1.1% on the quarter seasonally adjusted — slightly slower than Q2, but ahead of the roughly 5.1% economists polled by Bloomberg had expected. MAS described real estate as showing "firm activity". The official 2026 and 2027 growth forecasts are updated in November.
- Inflation firmed before easing off the boil. August core inflation was 2.2% year-on-year, up from 2.0% in July, with headline at 2.3% — driven by airfares and point-to-point transport. That upward drift was the basis for expecting an October tightening; the softer trajectory MAS saw is why it held instead. September's CPI is due around 23 October.
- Energy is the live risk to all of it. Brent has traded above US$100 through October and sat near US$105 in mid-month, after record tanker attacks in the Strait of Hormuz pushed crude up more than 5% on 8 October. Transits through the strait remain far below their pre-crisis baseline. MAS explicitly cites elevated energy prices among its upside inflation risks — and names a faster-than-expected recovery in Middle East supply as the main downside.
- The global discount rate moved against property. The US 10-year Treasury yield touched 5.364% intraday on 7 October, its highest since 2002, and was around 5.06–5.08% by mid-month. For a market where capital values are set against long bond yields, that is the number behind the investment-sales caution in §05 — even as nine-month volumes beat all of 2025.
- Watch China and the labour market. China's Q3 GDP is due around 19–20 October, with a Reuters poll median of 4.4% against a 4.5–5% target. At home, Q2 unemployment was 1.9% seasonally adjusted — the lowest since Q4 2024 — but layoffs reached 4,620, the highest since Q4 2020, and vacancies fell. Knight Frank cites exactly that rise in retrenchments as a reason buyers hesitated in Q3. Q3 labour data arrives around 30 October.
What we're tracking next
- 23 October: the full Q3 statistics from URA and HDB. URA warns that flash estimates have differed from final figures — and this quarter's flash carries an unusually large +1.4% built on thin volume. Whether it survives revision is the single most important number of the next four weeks. JTC's Q3 industrial data and September's CPI are due the same week.
- Does the index jump survive a normal quarter? If Q3's rise was a mix effect, Q4 should give it back as cheaper stock returns to market. The Serra Residences launched on 16 October at a guide above S$3,120 psf, and Thomson Reserve — 1,268 units, expected above S$2,600 psf — is the quarter's big test.
- The November BTO exercise: launch date, project names, Standard/Plus/Prime classifications and prices, plus the first evidence of whether August's higher income ceilings changed application behaviour.
- The million-dollar record. 2025's full year was 1,594; Q3 alone produced 597 and September set a monthly record of 209. We will report the annual position once the monthly counts are settled.
- The Fed's end-October meeting and whether December brings the second hike the minutes point to — and whether MAS's October hold looks prescient or premature when it next reviews in January.
- People's Park Centre — the 16 September tender outcome, still unreported — and Beauty World Plaza's third attempt, closing 19 November.
Go deeper than the monthly headlines
This briefing tells you what moved this month. The books explain the machinery underneath — policy architecture, market structure, and the decisions in front of you. And for the lighter side of property fever, there's Mr Mai.
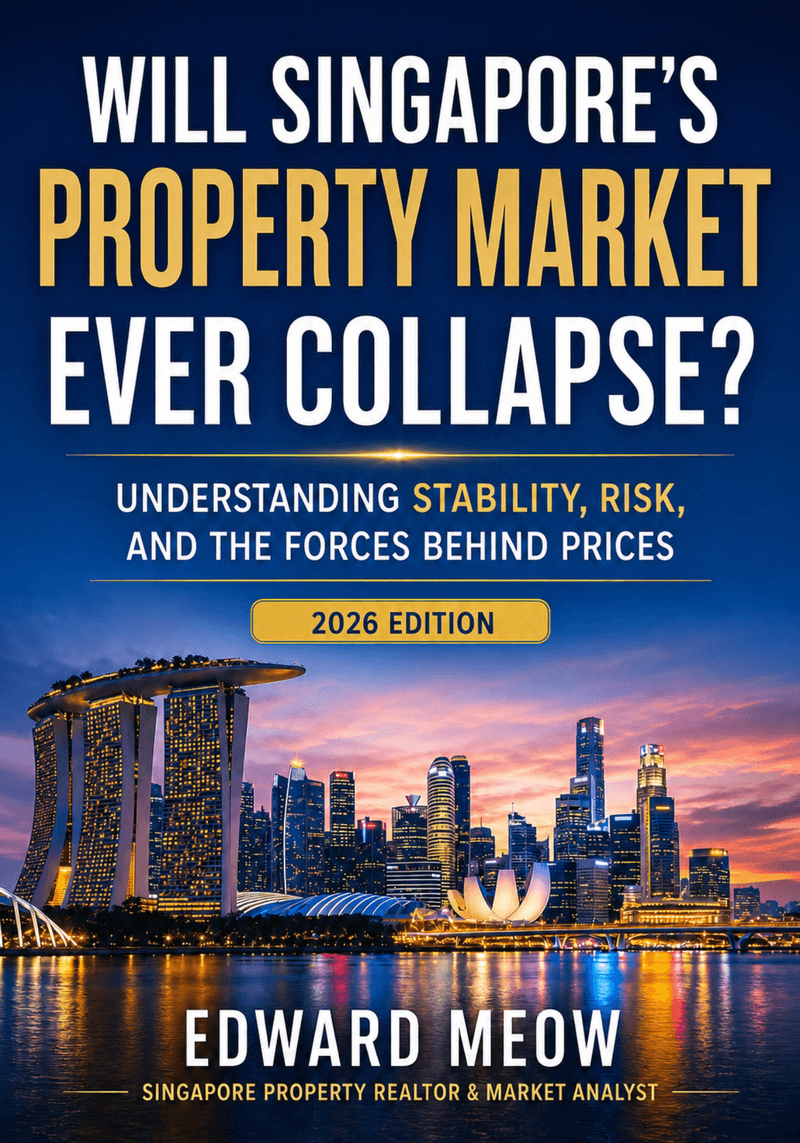 Premium research · S$5
Will Singapore's Property Market Ever Collapse?
123 pages on stability, risk, policy and the forces behind prices — with scenario modelling through 2036.
View the report →
Premium research · S$5
Will Singapore's Property Market Ever Collapse?
123 pages on stability, risk, policy and the forces behind prices — with scenario modelling through 2036.
View the report →
 Free guide
Singapore Property Guide for First-Time Buyers
A 63-page step-by-step handbook: budget, financing, grants, property types and the buying process — newly relevant to every household the higher ceilings just made eligible.
Read it free →
Free guide
Singapore Property Guide for First-Time Buyers
A 63-page step-by-step handbook: budget, financing, grants, property types and the buying process — newly relevant to every household the higher ceilings just made eligible.
Read it free →
 Animated comic · Book 1 free
Mr FOMO Mai — Lift B, Unit 12B & Other Confirmed Things
Eight animated episodes of property-fever satire from a Singapore condo lift lobby — for everyone who has ever refreshed a price chart at 2am.
Watch Book 1 free →
Animated comic · Book 1 free
Mr FOMO Mai — Lift B, Unit 12B & Other Confirmed Things
Eight animated episodes of property-fever satire from a Singapore condo lift lobby — for everyone who has ever refreshed a price chart at 2am.
Watch Book 1 free →
This issue draws on
- Official statistics & announcements: URA media release PR26-69, "Release of flash estimate for 3rd Quarter 2026 private residential property price index", 1 Oct 2026 (including GLS Confirmed List and completion-pipeline figures); HDB flash estimate of the 3rd Quarter 2026 Resale Price Index, 1 Oct 2026, with HDB's statement on the removal of the 15-month wait-out; URA September 2026 developer sales, released 15 Oct 2026; MND/HDB November 2026 BTO exercise details as reported 9 Sep 2026; MAS Monetary Policy Statement, 14 Oct 2026; MAS Financial Stability Review, September 2026 (data to Q2 2026, information as of 17 Sep 2026); MTI advance estimate of Q3 2026 GDP, 14 Oct 2026; MTI/SingStat Consumer Price Developments for August 2026, released ~23 Sep 2026; MOM Q2 2026 labour market report; US Federal Reserve FOMC statement and press conference of 16 Sep 2026 and FOMC minutes released 7 Oct 2026; SingStat table M212261 and the HDB resale price index via data.gov.sg for historical index levels.
- Market data & research: CBRE Singapore Figures Q3 2026 (12 Oct 2026); Cushman & Wakefield Singapore MarketBeat office, retail and industrial Q3 2026 (13 Oct 2026); JLL Singapore Q3 2026 office release (28 Sep 2026); Knight Frank Q3 2026 office and investment research (via EdgeProp, 28 Sep and 12 Oct 2026); Huttons Asia research on September developer sales, Q3 shophouse caveats (URA data as of 8 Oct 2026) and HDB resale forecasts; Realion/Christine Sun and ERA/Eugene Lim commentary on the Q3 flash estimates; CIMB Research on the Lorong Puntong land rate; SRX/99.co August 2026 condo resale flash (25 Sep 2026) and September 2026 HDB resale tracker readings; Stacked Homes compilation of URA September 2026 developer sales (15 Oct 2026); CDL announcement on Lucerne Grand; Singapore mortgage-package rate trackers as observed 6 and 14 Oct 2026; UOB SORA forecast as reported 25 Sep 2026.
- Press: EdgeProp Singapore, The Business Times, CNA, The Straits Times, The Edge Singapore, Little Big Red Dot, Real Estate Asia, 99.co, AsiaOne, Yahoo News Singapore, Reuters, Bloomberg, CNN and The Edge Malaysia reporting, September and October 2026, including coverage of the Q3 flash estimates (1 Oct), the MAS decision and Q3 GDP (14 Oct), September developer sales (15 Oct), the Amberwood at Holland and Lucerne Grand launches, the New Upper Changi Road, Lorong Puntong and Canberra Drive land tenders, and Strait of Hormuz disruption (8 Oct).
Q3 2026 figures from URA and HDB are flash estimates based on transaction data to mid-September; URA advises that flash estimates have differed from final outcomes, and the full Q3 statistics are due 23 October 2026. September monthly HDB readings are caveat-based tracker figures and may be revised. Office and retail rent levels are not comparable between research houses because each measures a different basket; they are reported here with the firm and basket named. The People's Park Centre tender outcome, the exact November BTO launch date, and the 2026 year-to-date million-dollar resale total were unconfirmed at press time and are labelled as such above rather than estimated. JTC's Q3 2026 industrial statistics had not been released. Analyst forecasts are attributed and are opinions, not facts.